Showing posts with label Vibration. Show all posts

Saturday, February 27, 2016

HOW TO CALCULATED OF THE SOURCES FREQUENCIES


The three sources of frequencies in machines are: generated frequencies, excited frequencies and frequencies caused by electronic phenomena. Generated frequencies sometimes called forcing frequencies are those frequencies actually generated by the machine. Some examples are imbalance, vane pass frequencies (number of vanes times speed), gearmesh frequency number of teeth times speed, various frequencies generated by antifriction bearings, ball passing frequency of the outer race, ball passing frequency of the inner race, ball spin frequency and fundamental train frequency. Generated frequencies are easiest to identify because they can be calculated if the internal geometry and speed of the machine are know.

Some of the calculated frequencies may be present in most machines without indicating a vibration problem. These frequencies at acceptable levels without sidebands, include but not limited to imbalance vane pass frequencies blade pass frequencies and gearmesh frequencies. Other calculated frequencies should not be present in any form at prescribed calibration levels. These frequencies include but not limited to ball pass frequencies of the outer and inner races ball spin frequency, fundamental train frequency. Calculated frequencies should not be modulated with any degree of significance by other frequencies. If any of  these frequencies are generated, a vibration problem exists.

When a rotating unit has a mass balance, it will generate a sine wave that has very little distortion. This signal can be observed in the time domain. The frequency domain spectrum will have a spectral line at one times speed of the unit. For example a 1776 RPM fan that is out of balance will have one spectral line at 29,6 Hz. Most pumps and fans can generated vane or blade pass frequency, which is the number of vanes or blades times the speed of the unit. A high vibration at this frequency could be the result of buildup on the vanes or blades, the vanes or blades hitting something or looseness associated with the rotating unit.  

Gearmesh frequency is normally seen in data taken from a gearbox or gear train. The frequency is the number of teeth on agear times the speed of that gear. For two gears in mesh, the gearmesh frequency will be the same for each gear, thr ratio of the number of teeth to gear speed ia constant. In a gear train, all gears will have the same gearmesh frequency. This vibration caused by teeth rotatingagainst each other. Multiplies and submultiples of gearmesh frequency are sometimes observable in the frequency spectrum and will be discussed later. For illustration consider a gear with 67 teeth is in mesh with a 22-tooth pinion gear. The gear is rotating at 6,4 Hz. Calculated a)what is the gearmesh frequency (GF) b) what is the speed of the pinion gear. The answer are:  
GF = number of teeth x gear speed
a) GF = 67 x 6,4 Hz  = 428,8 Hz
b) Speed of pinion = gear speed / number of teeth
speed of pinion = 428,8 Hz / 22 = 19,5 Hz

Excited frequencies, natural frequencies are the property of the system. Amplified vibration called resonance occurs when a generated frequency is tuned to a natural frequency. Natural frequencies are often referred to as a single frequency. Vibrations are amplified in a band of frequencies around the natural frequencies. The amplitude of the vibration in this band depends on the damping. When refer to natural frequency, often means the center of frequency. Natural frequencies can be excited by harmonic motion if the harmonic motion is within the half power points of the center frequency and contains enough energy.

The half-power points are down 3 dB on their side of the center frequency. The frequency range between these half-power points called the bandwidth of the natural frequency. The half-power point is 0,707 times peak at the center frequency. It is a general rule to stay a least 10% away from each side of the center frequency. If some frequency is within the bandwidth the center of frequency and his frequency contains enough energy to excite the natural frequency, the natural frequency will be present.

Friday, February 26, 2016

HOW TO MEASURING THE VIBRATION AMPLITUDE


Amplitude of the vibration level can be measure with four ways. The value of amplitude can be measure with peak to peak, zero to peak, RMS and average. Peak to peak is the distance from the top of the positive peak to the bottom of the negative peak. This method of measurement is most often used when referring tp displacement amplitude.
The value of zero to peak is the measurement from to zero line to the top of the positive peak or the bottom of the negative peak. This type of the measurement is most often used to describe the vibration level from a velocity transducer or accelerometer.
The Root Mean Square (RMS) is the true measurement of the power under the curve. The RMS value is 0.707 x peak only applies to pure sine wave. The true RMS value can be calculated by the square root of the sum of the squares of a given number of points under the curve.  The formula for true RMS they are:

RMS = square {(P12 + P22 + P32 +… Pn2)/n}

For measurement the value of the true RMS, the measurement for signals that it contain pulses must consider the value of the crest factor and duty cycle. The crest factor (CF) is the ratio of the peak value to the RMS value with the DC component removed. These formulas can be write:

CF = (P-DC)/RMS

For accurate measurement of pulse, the value of the crest factor is 7 normally can be used. The duty cycle is the ratio of the pulse width (PW) to pulse recurrence frequency (PRF). The formula for duty cycle they are:

duty cycle = PW/PRF

There are also several forms of pseudo are used in some equipments. This value of the pseudo RMS can be formula with

RMS = 0.707 x peak
RMS = square (AC2 + DC2 )


Analog meters is the equipments that can be use as to measure average amplitude. There are various the value of constants are the used to calculate peak, peak to peak, zero to peak, or RMS. Most measurements that are not true RMS measurements are either overstated or understated. When describing the vibration level of a machine, the RMS value should be used if possible. However some cases require peak to peak measurements, for example when measuring mils of displacement. Other case require zero to peak displacement measurement such as high places on the roll.
 The average values are measured by analog meters. The value average is the converted to peak by multiplying a constant of 1.57. These calculated values are accurate only when measuring pure sinusoids. The following constants may be helpful. However they apply to pure sine waves only. The more of the signal deviates from a true sine wave, the more a error is introduced.

Average = 0,637 x peak
Average = 0,90 x RMS
Peak to peak = 2 x peak
Peak = 1,414 x RMS
Peak = 1,57 x average
RMS = 0,707 x peak
RMS = 1,11 x average

Thursday, February 25, 2016

INTRODUCTION TO ACOUSTICS WAVE


Time
Any period motion will be have a frequency, we can say 60 cycles per second. This means if a one second time period was observed, 60 cycles would be present. However, it is not always practical to observe one second of time and count the numbers of cycles.
We can measure the time period for one cycle and calculate the frequency. We can also calculate the time period for one cycle if the frequency is known. Time and frequency are the reciprocal of each other. For example, if 60 cycles occur in one second, divide one by 60 to get the time period for one cycle. When determining the frequency from the time period for one cycle, divide the time period for one cycle into one.

If 60 cycles occur in one second and the time period for one cycle is 0,0167 seconds, the calculation can be verified by
f x Ï„ = 1 or 60 x 0,0167 = 1. For note, that the time period for one cycle of all frequencies above 1 Hz will be less than one second. Also note that if frequency is in cycles per second, time must be measured in seconds.

Frequency
The number of cycles that occur in one time period, usually one second we call frequency. Until a few years ago, frequency was identified as cycles per second (cps). CPS was changed to hertz honoring the man who developed the frequency theory. Machine speed is measured in revolutions per minute (RPM), but the frequencies generated by those machines are measured in hertz.
From the above discussion, the formula for frequency and time can be derived.
For simple, these formulas can be concluded with a triangle like picture.


where f equals frequency or number of cycles that can occur in one second, Ï„ equals the time period for one cycle and 1 equals 1 second in this case.


Acoustic Waves
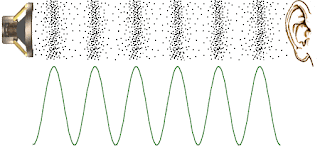
Acoustic waves are pressure disturbances that propagate through a compressible fluid, such as air, and are interpreted by the human ear as sound. Normally, these pressure disturbances are very small compared with ambient pressures, but they can be measured using sophisticated microphones. These waves usually propagate uniformly in all directions, unless the wave encounters a difference in impedance. Acoustic waves, just like other mechanical waves, experience reflection, scattering, diffraction, refraction, and interference.


Sound Intensity

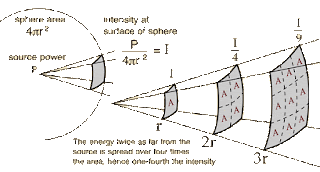
When analyzing enclosures, it will be useful to define the sound intensity and sound power of a source. The sound intensity, I, at a point is the time average of the instantaneous rate at which work is done by a sound wave as it travels. It is defined as

Where P is the sound power, A(r) is the area of a sphere of radius r. For spherical sound power sources the sound intensity are
Acoustic Impedance

The acoustic impedance plays a large role in the propagation of sound waves. By choosing materials of appropriate impedance, engineers can manipulate the sound transmission through a particular path. A wave will tend to continue uninterrupted in its path so long as the acoustical impedance in unchanged. By choosing materials with similar impedance characteristics, engineers can ensure the promotion of wave transmission, such as with ultrasonic testing. On the other hand, engineers can also suppress sound by choosing materials with much different impedances. For example, when a wave traveling through air (which has relatively low impedance) encounters a wall (which has very high impedance), the wave will reflect back on itself and much less of the wave will continue on in its previous path. Acoustical impedance is not merely a property of materials. Impedance also changes with changes in cross sectional area, bends, junctions, and openings. The acoustic impedance is defined as the ratio of the complex acoustic pressure to the complex particle velocity.


Where p is the sound wave pressure and u velocity of sound wave.
The noise level of household water pump we can measure easily. But for the more easily we define what that noise. The noise of a sound that is psychologically disturbing. Noise causes the listener to feel disturbed in their daily activities either at work, study or sleep. And even more fatal consequences will cause deafness in the listener's ears.The water pump is generally still widely used by households, especially in regions that are still sack groundwater needs. The use of water pumps generally produce noise. This will cause sleep disturbance when the water pump is operating at night.To reduce noise / loud this can be done by using active or passive methods. Active method is a method that uses sound waves of different phases with a wave of noise there. While the passive method is a method that uses acoustic material.The first step that must be done to control the noise level is certainly familiar sound sources produce noise. The next step measuring the sound pressure level (Sound Pressure Level, SPL) on the source of the sound. Finally new noise control methods can be applied accordingly.Measurement of the noise level of this water pump can be done easily. The tools used are sound level meter, the market price is still relatively cheap. But if there can be used an android Smartphone application that has installed a Sound Level Meter. These applications are generally still free.Noise measurement in done by first dividing the dimensions of the pump into several parts, namely, top, right side, left side and so on. Each section is divided into a number of measurement points. Each point can be measured SPL her big 3 times or more as shown in the picture
 
After the data obtained further spool water pump is made in the form of noise contour. Noise contours that have been completed can be seen in the following figure
 
From this noise contours then we can start designing a method for efficient and effective reduction shall we do to the water pump.

Post will later be followed by a simple experiment everyday materials that can be used to reduce the noise of the water pump.

thanks hopefully useful
 

PENGENALAN ROBOTIKA

1.1  Apa Itu Robot? Kata Robot berasal dari bahasa Ceko (robota) yang artinya buruh paksa atau budak. Ini seperti seorang hamba, Jika kita m...